Does the Record Sale of Steele Creek Apartments Cherry Creek Signal a Top

I remember when Steele Creek Apartments were proposed for the Southeast corner of Steele Street and 1st Avenue, at the time occupied by a few Class C buildings and a discount dry cleaner.

With the news hitting that the building set a new record on a per-unit basis for the sale of an apartment building of $570,000 per unit does the valuation make sense even considering future equity appreciation?

Working in both New York and Denver such numbers are not surprising as in NYC such a deal would be a steal especially for a newer construction building minus any rental controls, statutory affordable housing or long-term leases. Yet Denver is not New York.

Granted we have seen other close to blockbuster deals in Central Denver concerning rental properties as excerpted below from my morning daily read BusinessDen including but not limited to:

However are these deals good money-chasing returns, which are far from guaranteed? One could argue Denver at present is in an up cycle with record high rents (even though some buildings are offering rental incentives). Yet I am concerned as follows:

The New Rental buildings are oriented to deluxe and luxury tenants offering studio to 2-bedroom configurations limiting marketability to affluent singles and couples. In New York and San Fracisco the highest prices on bith a per-unit and PSF basis are “family-oriented” apartments considering of usually 2-4 bedrooms and minimum 2 bathrooms where a family can be reside comfortably.

Is there a glut on the horizon in the marketplace? Between Lower Downtown and Cherry Creek along the Speer Boulevard/1st Ave. corridor we are witnessing new buildings sprouting up like weeds with the assumption that demand for luxury rental apartments will continue unabated.

The Millennial Generation Will Age: I am witnessing it in my real estate practice; millennial’s are pairing up, starting families and due to price pressure are looking at homes to purchase in outlying Denver and suburban neighborhoods; not much different how Brooklyn became chic when Manhattan rents became unaffordable (with some help from Michelle Williams and Maggie Gyllenhaal and for us old timers, Patty Duke lived in Brooklyn Heights).

If the Influx Slows Who Will Rent these Apartments? While certain buildings have a reputation for attracting empty nesters (25 Downing Street) and those whose change in lifestyle may necessitate move to an apartment from a home (The Seasons at Cherry Creek), while renting is an option, many opt to purchase. Again anecdotally I know two empty-nest couples who moved from Country Club to condos, one in downtown, one in Cherry Creek.

What is Trendy Today is a Maintenance Headache Tomorrow: We see this in buildings throughout Capitol Hill, the party rooms with the naugahyde chairs on brass wheels and the pool table that has seen better days or the pool which requires constant expensive maintenance and upkeep.

While I understand the attractiveness of the cost on a per unit basis when compared to other in-demand cities including San Francisco, The Northeast Corridor (from Boston to Washington DC), Los Angeles and so forth those cities have physical geographic constraints and draconian rent-control laws which circumvents true market supply and demand laws thus raising rents on the free-market inventory.

Thus I do not see how the numbers work based on existing rental rates even when factoring in equity appreciation and nominal inflation. Granted there is always the option of conversion from rental to condo. The process includes upgrading the common areas and interiors of unitsoriented to the for-sale market AND developing a legal condominium, HOA and so forth. Not unheard of in Denver i.e. The Barclay (which when first converted were offered with developer backed below-market financing), Brooks Towers and other buildings have experienced such conversion.

However at present transaction cost per unit, is there really the demand for the $600K one bedroom condominium? We have seen such sales in smaller boutique developments including 250 Columbine (which does have a Starbucks on the retail level), but it is rare and definitely a niche market.

From experience such condos sell to those looking for a pied-a-terre in which their primary residence is NOT Denver or potential investment however for a decent cash-on-cash return the rents do not justify the selling price.

In New York City developers take the opposite approach developing condos and if the plan if sales do not meet the pro-forma then re-branded as a rental with the option to sell individual units when the market strengthens.

At present looking at prices coupled with construction activity I would be “short-selling” the apartment market if such a vehicle existed. Long-term I may be proven wrong, however within the three-five year time horizon and even in the present as leasing entities/developers are offering rent concessions, I would be more concerned versus excited at the blockbuster record prices being recorded.


Why Continued Positive Comments About the Housing Market Scare Me

As a broker I make my living assisting clients purchasing and divesting of their real estate holdings. In this market of ever seemingly positive news I should be thrilled. Yet as a 20+-year broker licensed in two states I have some serious concerns on the macro level, which truly reverberates beyond home sale statistics.

At present the Denver market as well as the US market looks very healthy. Demand is high, employment and wages are growing, and mortgage rates are low.

However based on reports out this past week, if one reads between the numbers and taking into account history and growth trends, the market is quite challenged. Not at present but longer term we may be setting ourselves up for a dramatic shift in the economy and wealth accumulation.

There is continued strength in the overall national housing market with prices 6% higher than the same period one year ago. Some local markets continue to show double-digit growth in prices. Metro Denver’s year over year was 7.9%. Such numbers are driven by the simple law of supply and demand and specifically the limited supply at the lower end of the market. Thus lower end homes are witnessing significant price appreciation due to more competition while higher end listings are languishing or having price reductions (see my last blog).

While I have mixed feelings on Zillow and similar sites, their insights and digesting of data is always an interesting read: “It sets up a situation in which the housing market looks largely healthy from a 50,000-foot view, but on the ground, the situation is much different, especially for younger, first-time buyers and/or buyers of more modest means,” wrote Svenja Gudell, chief economist at Zillow in a response to the latest home-price data. “Supply is low in general, but half of what is available to buy is priced in the top one-third of the market.”

So why is the inventory and supply on the lower end of the market so challenged? A few reasons and many can be seen in your local neighborhood:

Conversion of Inventory from Home Ownership to Rental: During the Great Recession which many of us brokers also call “a housing crash”, investors from large hedge funds to Ma and Pa purchased 100’s of thousands of foreclosed properties. While some were fix and flips, the vast majority became income-producing rentals. At present according to the U.S. Census there are 8 million more renter-occupied homes than there were in 2007.

Granted some renters may be scared off from purchasing and while the investors could cash out and after paying simple capital gains have a nice windfall, at present the cash-flow on rentals is one of the most attractive investments in the market coupled with the underlying equity appreciation of the real estate; thus the motivation to sell is limited. In turn lower end and moderate homes are not coming on the market in meaningful volume.

New Home Sales are Down: In August 2017 there was a 3.4% monthly drop concerning new home sales. If demand is so strong shouldn’t new home sales be booming? Well, it is again simple economics and in this case pricing.

In August just 2 percent of newly built homes sold were priced under $150,000, and just 14 percent priced under $200,000.

Builders advise they desire to build more affordable homes yet profit margins or the lack of is causing constraints. Builders blame the higher costs of land (exurbs with lower cost land is falling out of favor with 1st time home buyers who desire to be closer to urban centers), labor, materials and regulatory compliance i.e. building and zoning codes (and this is before the hurricanes decimated Houston, southern Florida, Puerto Rico and the US Virgin Islands which will demand laborers and materials to rebuild leading to eventual inflation in those industries and supply chains.

One could argue that market forces will eventually realign the housing market. Yet when this will happen is anyone’s guess. Considering we are still in a “Goldilocks economy for housing i.e. jobs and income continue to grow, interest rates remain at historically low levels, financing rules have become more flexible and inflation remains tame at below 2% annually. So what is the problem?

At present our inventory of new and existing homes is static with numbers similar to those found in the mid 1990’s a full 20+ years ago HOWEVER during those 20+ years the country’s population has expanded by 60M. Couple this with a mismatched market as home prices will not come down as long as there are buyers out there willing and able to spend more and more money for less and less house as we have witnessed in hot markets i.e. San Francisco Bay Area, The Northeast and other markets.

Longer term is my concern. We have witnessed locally in Denver our market moving from purchasers to renters. Good for investors not so good for individuals concerning personal wealth. Homeowners are known for making big-ticket purchases i.e. appliances and upkeep and maintenance sustains the construction sector i.e. additions, roofing and so forth.

If we move towards a renter oriented housing market fewer Americas will be able to save and grow their money associated with the ownership and upkeep of a personal owner-occupied residence. Due to demand rents may continue to rise (as less inventory on the market) and thus renters will have less disposable income to spend which will ripple through the economy beyond housing.

Yet Denver may be the litmus test for the national economy as follows:

Upper-End of the Market: is slowing dramatically as prices rose to fast and thus not sustainable. Upper-end buyers are usually market savvy and thus will be more cautious entering the market. Even in the Country Club neighborhood I have witnessed price-drops and re-listings at lower prices all in an effort to generate activity; would have been rare one year ago

Lower-End of the Market: Supply is outstripping demand with the average home in Metro Denver over $410K; yet incomes/wages have not kept up as the average worker is slowly being shut out of the market and thus will be a perpetual renter,

Rentals: The vast majority of new rental buildings are priced at luxury levels (just look at the cranes in Cherry Creek North). Yet that market is slowing and many of the existing buildings are struggling to attract tenants and now offering rental incentives. Yet additional buildings continue to come out of the ground.

Zoning and Entitlements: In Denver while zoning has allowed additional density and not without controversy i.e. slot homes in Cherry Creek, while beneficial to rental development, most rentals are oriented to single and couple households, with few exceptions most new multi-family buildings are not designed for families or larger households.

The above is just some food for thought. Add an existential crisis and this housing “House of Cards” may come to an ugly resolution. While I am not predicting another housing crash, the off-balance market is not sustainable and the overall repercussions to the overall economy have not been considered, quite dangerous.

Is Irrational Exuberance Giving Way to Rational Behavior

I recently enjoyed a conversation with a friend who is about to list their residence in one of Denver’s most affluent neighborhoods (of note I was NOT in the competition for the listing). He mentioned what they plan to list the home at. I asked if they were planning to use the broker whom they have a personal relationship with and they advised no as what they wish to list the home at, the broker would not take the listing feeling the asking price was overly aggressive. Another broker has since been retained to market and sell the home.

Full disclosure, the home is spectacular from a conservative design perspective including solid pre-war construction, beautiful curb appeal, and a park-like oversized lot professionally landscaped and so forth. Of course there are some minor deficiencies yet nothing insurmountable. However when I was advised of the asking price my immediate reaction based on my experience in the present market was “Good Luck”.

I personally went through a similar situation with clients in 2011. Due to a change in employment status and other factors including owning the largest home on the block purchased at an inflated 2006 price, a challenging layout  and across the alley from a primary school  the sellers and this home had multiple challenges. At the Listing Presentation with a peer broker in attendance we advised the seller the asking price should be between $710,000-$720,000. The seller requested I place the house on the market for $839,000 (their purchase price was over $800K plus interior upgrades leading to a cost-basis in excess of $840,000). As a friend first and broker second (and I have since learned my lesson) I did as requested. After one month, multiple open-houses and two formal showings the sellers agreed to lower the price. The new asking $739,000, still above what was advised the prior month. Fifty yes 50 showings later and 9 months on the market not one offer! We decided to part ways. The seller hired another broker, within one week did a price reduction and subsequently sold the residence for $715,000.

It took the seller ten(10) months to sell for $715,000 which I had advised, from day one AND at $4,000/month mortgage, do the math, $40,000 before interest deduction, not exactly the most brilliant strategy.

Thus based on the above examples and seeing signs of a slowing market and for my own edification I decided to look at market activity both present and looking back at Sold Activity over the past 6 months.

Let’s start with Country Club (the borders are from Downing St. to west-side of University Blvd, 1st Avenue to 6th Avenue).

Sales Activity over the last 6 Months Country Club Neighborhood of Denver:

  • # Of homes sold: 7
  • Avg. Finished SF: 3,510 SF
  • Avg. Total SF: 4,482 SF
  • Average Sold PSF Finished: $568.38
  • Average Sold PSF Total: $445.01
  • Average Days on Market: 24 Days

On the Market at Present:

  •  # Of homes on the market: 8
  • Avg. Finished SF: 3,186 SF
  • Avg. Total SF: 4,419 SF
  • Average Sold PSF Finished: $557.31
  • Average Sold PSF Total: $424.36
  • Average Days on Market: 68 Days and counting

Based on size the differences between the Sold’s and on market is marginal and same concerning the Price per Square Foot however what is telling is Days on Market (DOM). The Sold’s over the last 6 months on average sold in 24 days. Yet those on the market today is average 68 days and counting. The difference, over one month, almost a month and a half.

I admit one could argue the homes on the market at present may have challenges from location to upkeep however as asking prices based on a Per Square Foot basis stayed relatively the same, the issue is the longer on market time. Number of days on market has more than doubled. Yes there are seasonal factors however many pundits argue the selling season is now year round.

My personal view is market demand is softening and asking prices are yet to adjust to the new market realities.

Of note, Country Club is a small, insular neighborhood with limited inventory and limited turnover. Thus I also looked at Cherry Creek North (1st Avenue to 6th Avenue, University Blvd to Colorado Blvd) to provide a more balanced view, granted however balanced one of the metro’ area’s most affluent neighborhoods can be. However with the diverse housing stock and density, a clearer picture may emerge.

Sales Activity over the last 6 Months Cherry Creek North Neighborhood of Denver:

  •  # Of homes sold: 53
  • Avg. Finished SF: 2,396 SF
  • Avg. Total SF: 3,335 SF
  • Average Sold PSF Finished: $436.10
  • Average Sold PSF Total: $332.28
  • Average Days on Market: 53 Days

On the Market at Present:

  •  # Of homes on the market: 94
  • Avg. Finished SF: 2,393 SF
  • Avg. Total SF: 3,416 SF
  • Average Sold PSF Finished: $595.36
  • Average Sold PSF Total: $412.07
  • Average Days on Market: 95 Days and counting

Again as with Country Club based on size the differences between the Sold’s and on market is marginal and same concerning the Price per Square Foot however what is telling again is Days on Market (DOM). The Sold’s over the last 6 months on average sold in 53 days. Yet those on the market today is average 95 days and counting. As with Country Club the difference is almost a month and a half.

Conclusion: In both neighborhoods asking and closed prices have stayed somewhat status quo. However in a hot housing market the number of days on market is telling. Granted one could use the seasonal differential argument. Maybe; however in both neighborhoods we are seeing the Days of Market mirror each other i.e. almost a month and a half difference.

I may be incorrect and I admit when I am however I believe the market is definitely showing signs of slowing based on Days on Market coupled with levels of inventory. Yes the two markets are considered luxury markets yet what happens at the upper-end of the market historically trickles down to other market segments. What will be interesting is when we will begin witnessing price adjustments.

It seems the pinnacle of the market may have been 6-12 months prior and the market is now possibly taking a well-deserved breather or maybe showing signs of a changing business cycle.

Considering interest rates have remained stable; actually still close to historic lows, the stock market continues to flirt with record highs and the recent issues with N. Korea are too recent to influence the housing market.

I believe the optimists will advise it is a natural seasonal shift, me being the conservative pessimist would advise, hang tight if you can it may be a bumpy ride ahead.


Head and Shoulder Pattern in Denver Real Estate

As readers of my blog know I am somewhat a statistician as I look at various statistical measurements including the well respected Case-Shiller index concerning housing costs. Please note statistics are similar to an appraisal; they are a look back and not necessarily a look forward. I also believe history repeats itself as I have been a broker for 20+ years and have watched with interest the effects of business cycles on our real estate market.

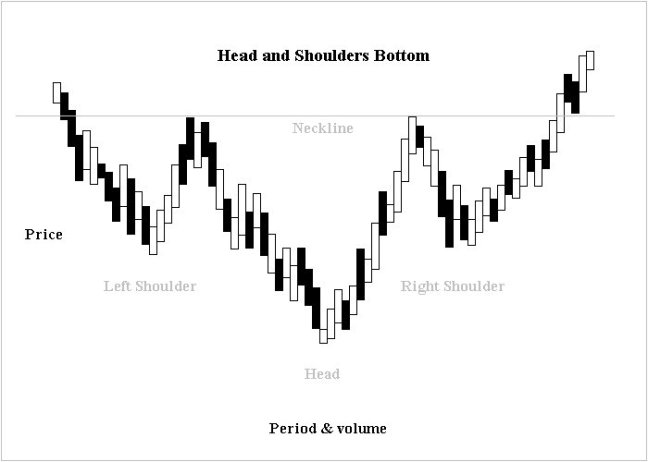
Please note I am not advocating the following analysis concerning a Head and Shoulders pattern adopted from the stock market HOWEVER housing prices in general trend with the stock market. Thus reviewing the latest statistics and graph patterns I noticed a head and shoulders pattern-taking place in the Denver (and other) housing markets: The following is a graphic of a Head And Shoulders Bottom as related to equities:

H_and_s_bottom_new

Per Wikipedia: This formation (Head & Shoulders Bottom) is simply the inverse of a Head and Shoulders Top and often indicates a change in the trend and the sentiment. The formation is upside down in which volume pattern is different from a Head and Shoulder Top. Prices move up from first low with increase volume up to a level to complete the left shoulder formation and then falls down to a new low. It follows by a recovery move that is marked by somewhat more volume than seen before to complete the head formation. A corrective reaction on low volume occurs to start formation of the right shoulder and then a sharp move up that must be on quite heavy volume breaks though the neckline.

Another difference between the Head and Shoulders Top and Bottom is that the Top Formations are completed in a few weeks, whereas a Major Bottom (Left, right shoulder or the head) usually takes a longer, and as observed, may prolong for a period of several months or sometimes more than a year.

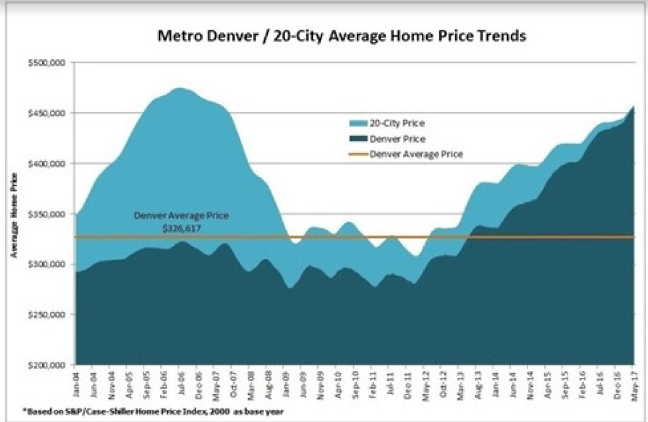
Screen Shot 2017-08-11 at 8.41.30 AM

In May 2017 according to the Case Shiller index the average home price in Denver reached $456,100 which is 41%+ higher than the previous peak experienced in Denver in August 2006 which many will remember was the pinnacle before descent into the Great Recession.

While the graph is not the easiest to comprehend yet the visual is strikingly similar to the Head and Shoulders Bottom, the following is the pricing and trend over a 17-year period, which I have mentioned in previous blog posts including the pricing history and activity of a home in Country Club.

  • 17 years: Average Annual Increase: 5.8%
  • 10 Years: Average Annual Increase: 4.6%
  • 3 Years Average Annual Increase: 10%
  • 1 Year Average Annual Increase: 7.9%

The average cost of a home in Denver throughout the past 17 years:

  • 2000: $230,000
  • 2007: $313,500
  • 2010: $290,000
  • 2014: $350,900
  • 2016: $422,800
  • 2017: $456,100

Are times and trends different from the Great Recession at present? Yes. Lending standards have tightened, sub-prime lending seems to be under control and we continue to be in a Goldilocks Interest Rate environment.

However just on a business cycle trend I have some concern and this does not include outside influences i.e. saber rattling concerning North Korea which impacted the equity markets worldwide yesterday with the largest point downtown since May 17th, 2017.

I am not a market forecaster however based on the statistics and graphs presented in this blog my level of concern for a retrenchment in prices is ratcheting upward. We are witnessing price adjustments in the upper-end of the market and if interest rates were to increase we would see affordability challenged further and average prices go down. Not necessity a negative as we continue to be in a seller’s market and average buyers are challenged concerning affordability and inventory, not a positive long-term trend for our housing market. I am not making any predictions, just showing statistics and voicing some concern.


Is A Real Estate Bubble in Colorado’s Immediate Future

Many of my real estate peers continue to bask in the glory of this continued bull market in Metro Denver. I understand this as both personally and professionally I too am frustrated with the lack of inventory; a marketplace which continues to show a demand side bias seemingly unabated.

Yes I have been accused of being a pessimist. As I advise I have been in this business for 20 plus years AND been a resident of the State of Colorado since 1984. Thus I have been through a few business cycles and was fortunate to purchase the home I just sold back in 1989 as Denver was coming out of a commodities influenced regional recession which was a catalyst for Denver’s now more diversified economy.

This morning, during my scan of the headlines a story came across the wires; this one relates to states with potential real estate bubbles. Posted on AOL Finance the article mentions 8 states in which a real estate bubble may be forming.

Per the article and quoted as follows it is important to understand “Today, most experts agree that, on a national level, we are not in a real estate bubble. The absence of nationwide or statewide housing bubbles doesn’t mean they’re not forming, however, or that they don’t already exist within some states on a more local level.”

The States mentioned in the article are California, Texas, Florida, Washington Tennessee, Colorado Oregon, and Nevada. On the national level due to changes in mortgage requirements and desires for home ownership we have witnessed income to house value ratios increase. Historically from 1950-2000, median home values have been roughly 2.2 times the median income. Today, that number is roughly 3.36 times higher, 50 percent higher than the historical average. Granted there are more choices concerning mortgage instruments and our society in general has collectively accepted the concept and use of leverage. We now know leverage and inflated valuations led to the most recent Great Recession. Unlike the Depression of the 1930’s which was particially caused by a bubble in tradable equities, The Great Recession began with a housing bubble as housing was and continues to be viewed as an investment vehicle and thus being leveraged.

Driving through Cherry Creek North and Downtown and seeing the cranes on the horizon coupled with the frenzied construction activity all along the Front Range from the Foothills to the Plains, I am starting to be concerned. A low-interest rate, high-demand environment must at some point correct, when is the question:

The following is excerpted from the AOL Finance article:

Colorado’s housing market is overvalued, according to Fitch Ratings. But why is overvaluation important to real estate bubbles?

People believe that the asset, often real estate, is going to become more and more valuable in the future. If it becomes more valuable because it produces more income, that is one thing,” said David Reiss, a real estate expert and law professor at Brooklyn Law School. But if it becomes more valuable just because people think it is going to become even more valuable, that is another. At some point, the merry go round stops and the current owners are left with an asset worth less than what they purchased it for.

In Colorado, home prices in major markets like Fort Collins and Boulder are not just overvalued, they’re more overvalued than they had been at their peak during the 2005-2006 housing bubble, hardly an encouraging sign. Making matters worse, incomes are failing to keep up with rising price.

Several Colorado metro areas are seeing price-to-income ratios above both the national level and their historic averages. The median home price in Denver and Fort Collins are roughly five-times the median income. In Boulder, the home price-to-income ratio is even higher at 6.6 and is more than 100 percent higher than the historic average.

To be clear, high home prices don’t necessarily equate to a bubble, said Jeff Shaffer of McKinley Partners, a real estate private equity firm. “A typical bubble starts with high prices causing capital to start flowing quickly into that space because of attractive returns. So high housing prices may spur a bubble down the road, especially in markets like Denver, where you see a lot of new home development in the pipeline to open up,” he said.

According to RealtyTrac, a real estate information company and an online marketplace for foreclosed and defaulted properties, Denver County has the nation’s lowest affordability index as of second quarter 2017, meaning it has the least affordable prices compared to historical averages. Adams County and Arapahoe County, both in the Denver metro area, also rank among the worst for housing affordability.

Personally I am more concerned about the Front Range versus the State of Colorado. Yes our resort communities are very dependent on real estate transactions for transfer taxes and so forth. However I am not seeing the frenzied activity west of the Continental Divide that I see on the Front Range. Thus if a bubble is forming, I believe it may be Front Range specific and while impacting the whole state if it bursts, the damage I believe will be most acute along the I-25 corridor from the Wyoming border to Pueblo.